
Thomas Colin / Brisbane
Experiments with data.
Each project below has a short note on how I built it and a link to the code, so you can make your own.
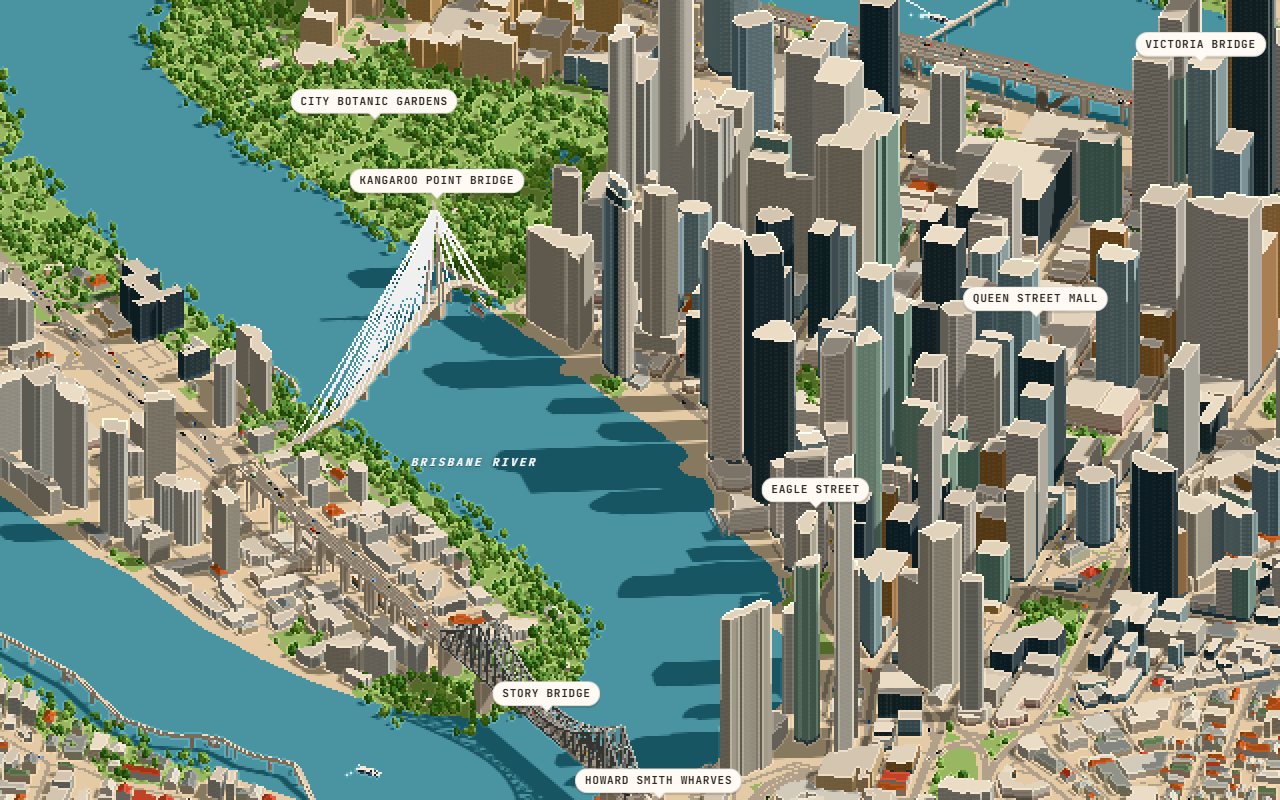 3D
All work
5 pieces
 3D
2026 / three.js / WebGL / Open map data
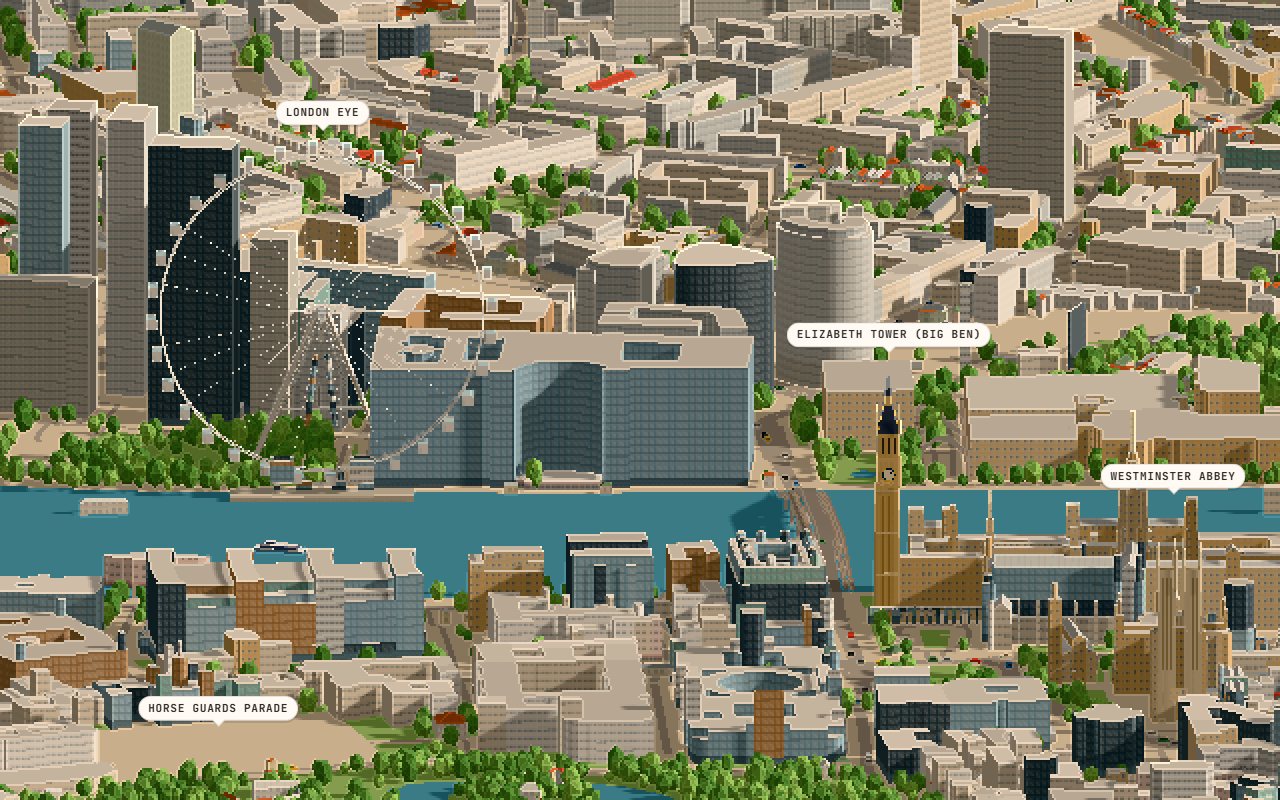
London pixel diorama
A 3D pixel-art model of central London, with its landmarks built by hand, that you can fly around.
 Scroll
2026 / Canvas / Scrollytelling
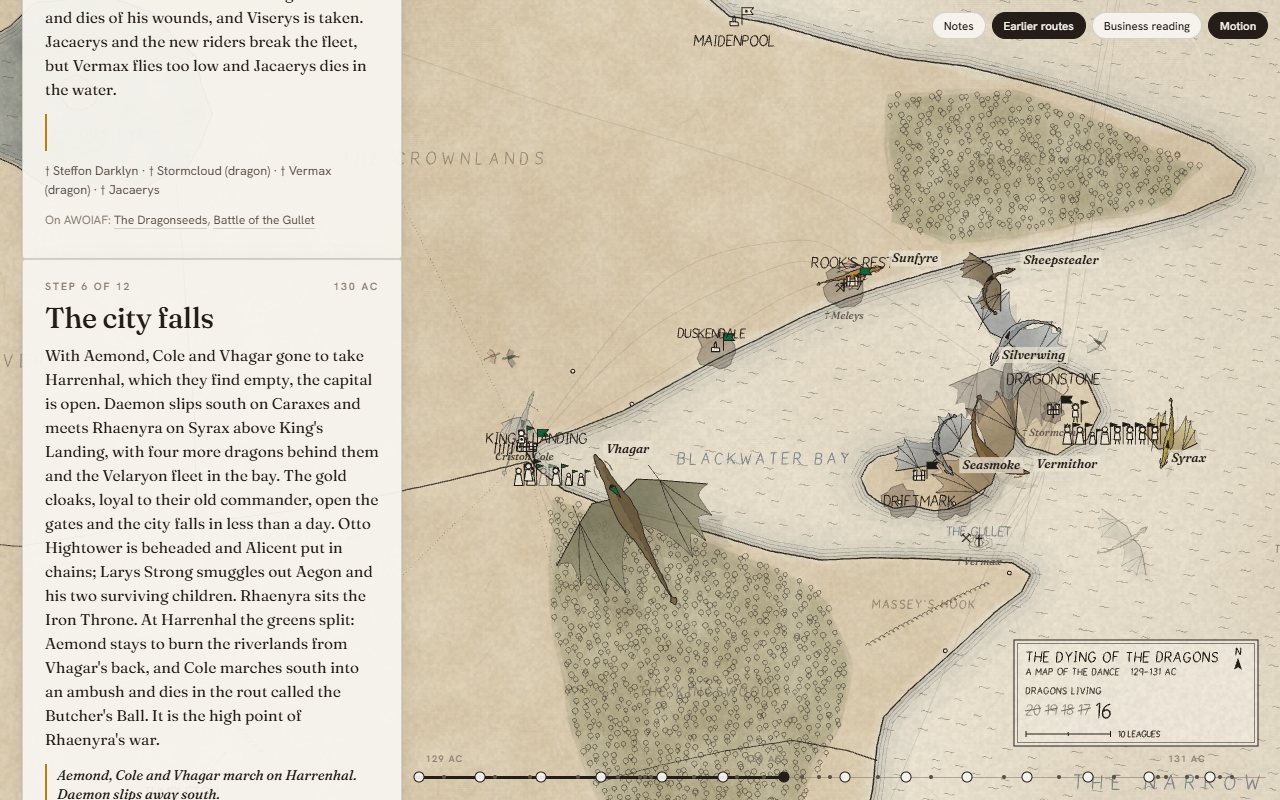
The Dying of the Dragons
A hand-drawn, scrolling map of the Targaryen civil war, in which the sky slowly empties of dragons.
 Network
2019 / D3 / Network analysis
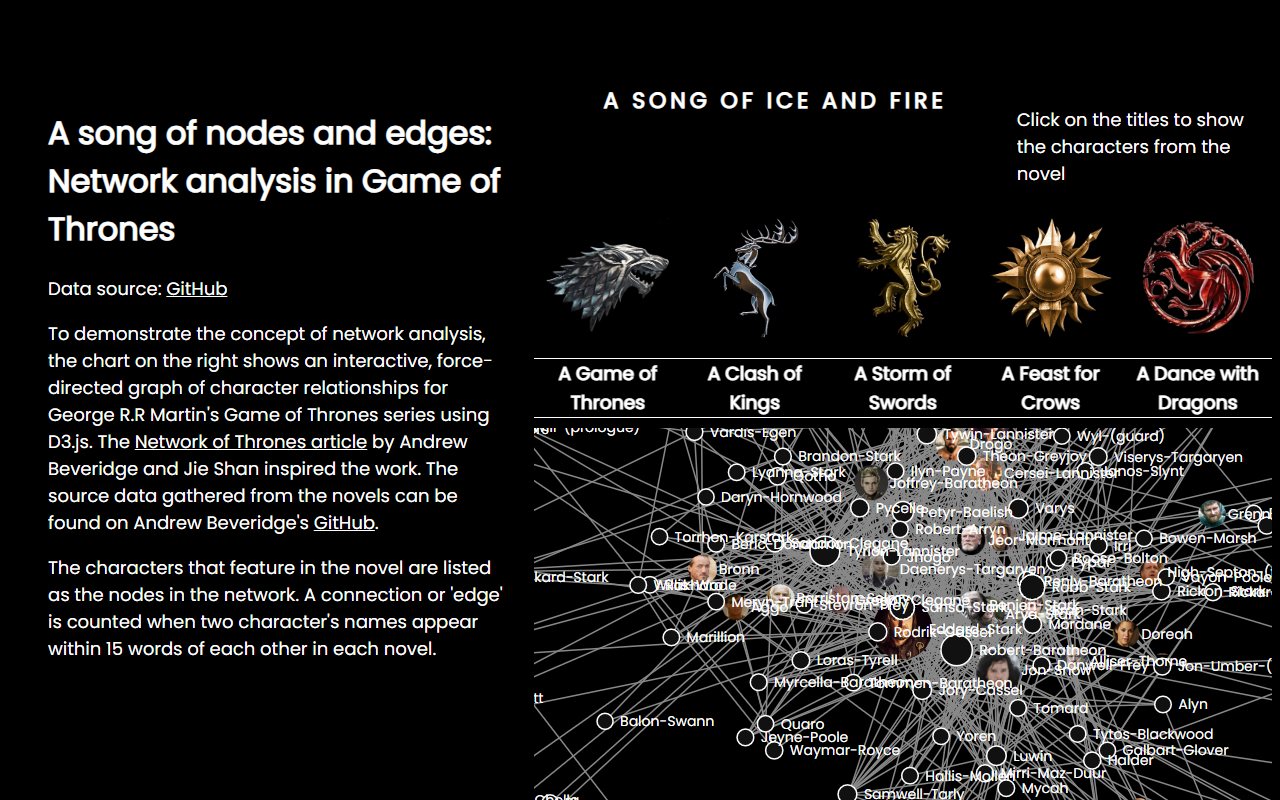
Game of Thrones networks
Who matters in A Song of Ice and Fire, as force-directed networks of the characters in all five books.
 Scroll
2025 / D3 / Scrollytelling
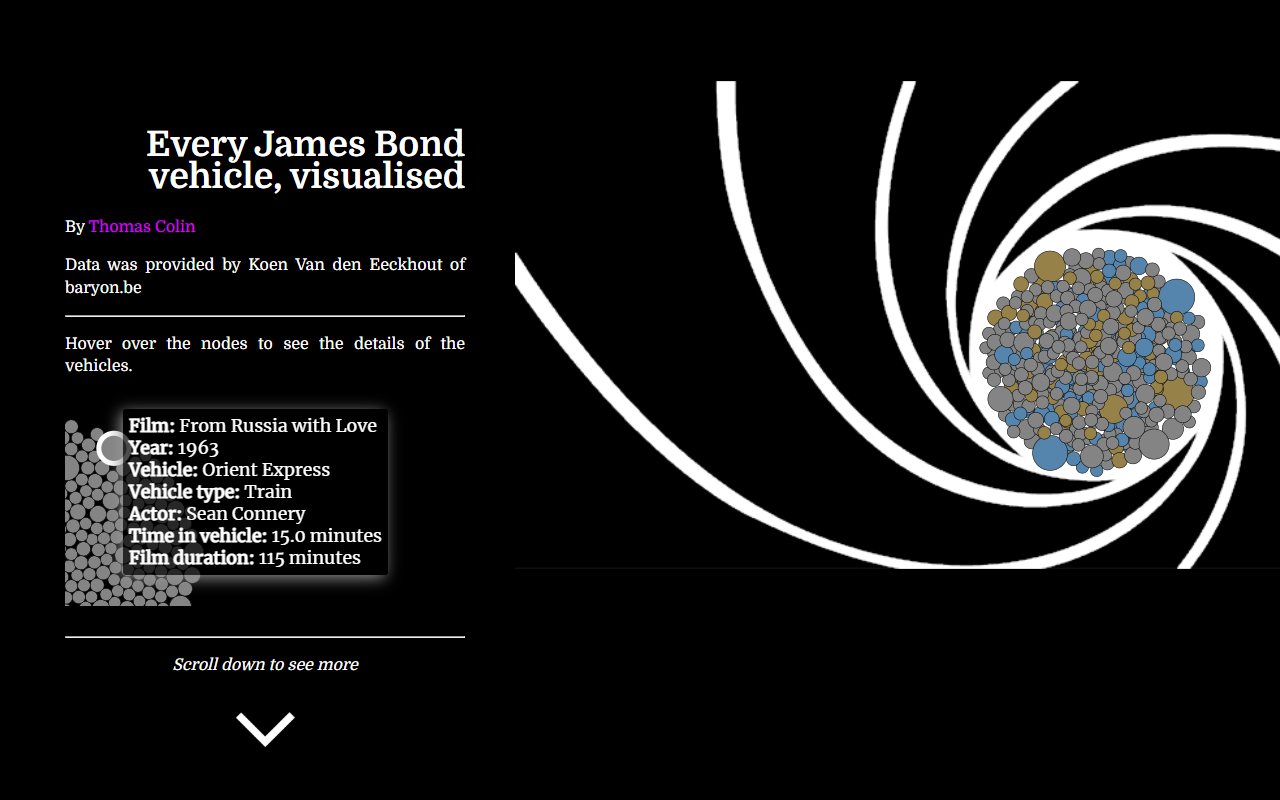
Every James Bond vehicle
A scrolling story of every scene Bond spends in a car, plane, boat or train, across 25 films and 60 years.
About
I'm Thomas Colin, a data scientist in Brisbane. I've spent my career turning data into information, most recently at Atlassian.
Data Skunkworks is where the experiments live: each piece starts with a question and ends with something you can poke at.
The code for every piece is on GitHub.