D3.js Portfolio
Interactive data visualisations built with D3.js — exploring networks, scrollytelling, animation, and creative data stories.
↓ Scroll to explore
Projects
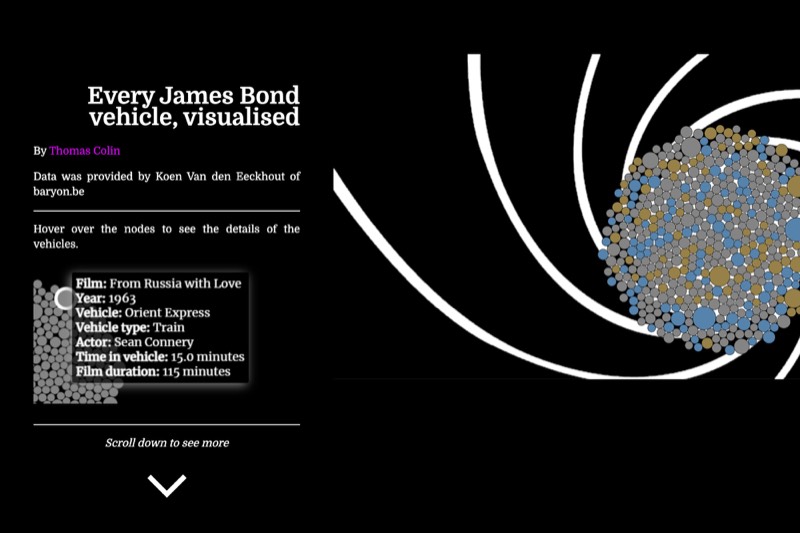
Every James Bond Vehicle
A scrollytelling visualisation of every vehicle driven across the Bond franchise. Hover to explore each one.
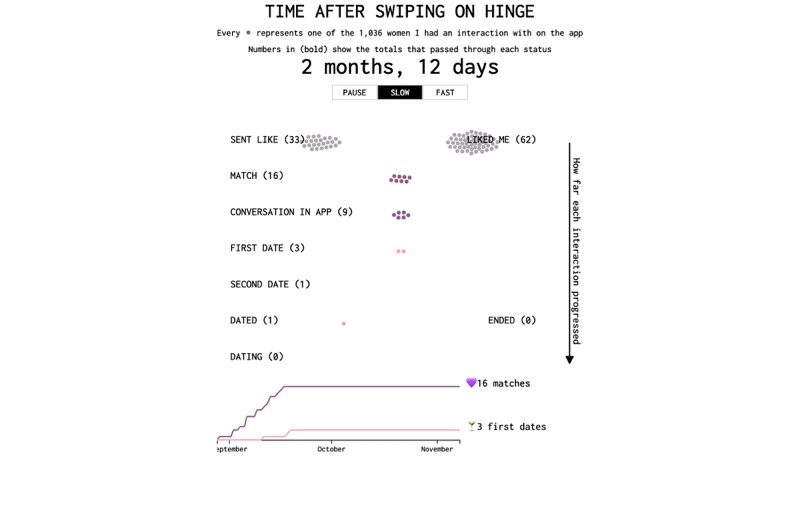
Time After Swiping on Hinge
Animated bubble visualisation tracking 1,036 interactions on the dating app over time. Play, pause, and control speed.
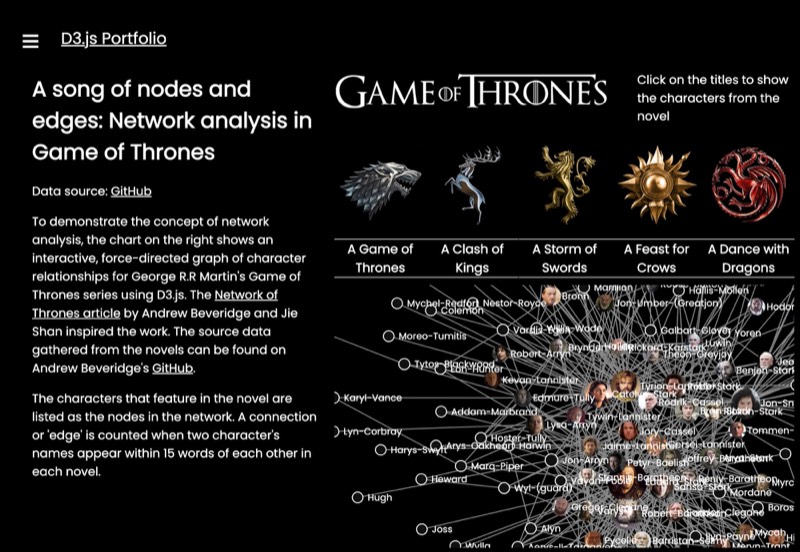
Game of Thrones Networks
Force-directed network graphs of character relationships across all five books in the series.
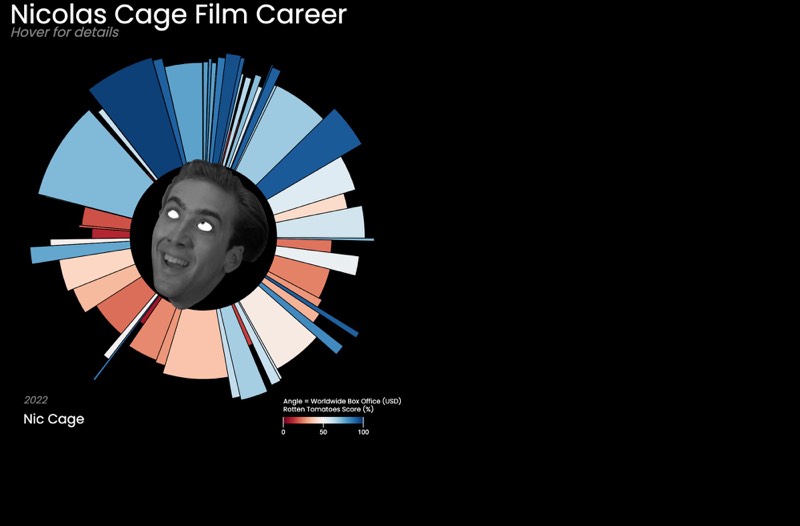
Nicolas Cage's Film Career
An interactive donut chart exploring Nic Cage's filmography — with eyes that follow your cursor.
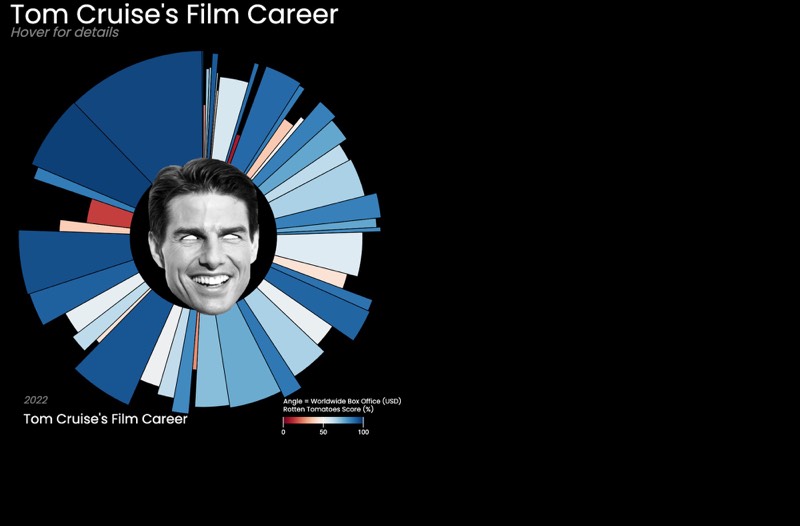
Tom Cruise's Film Career
Same concept, different legend. Interactive filmography donut chart with eye-tracking effect.
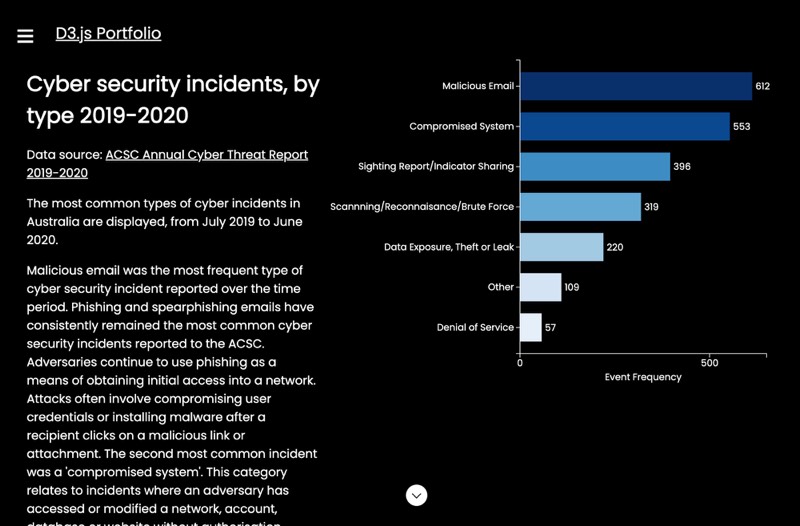
Bar & Stacked Bar Charts
Responsive bar chart examples with tooltips and transitions, including stacked variants.
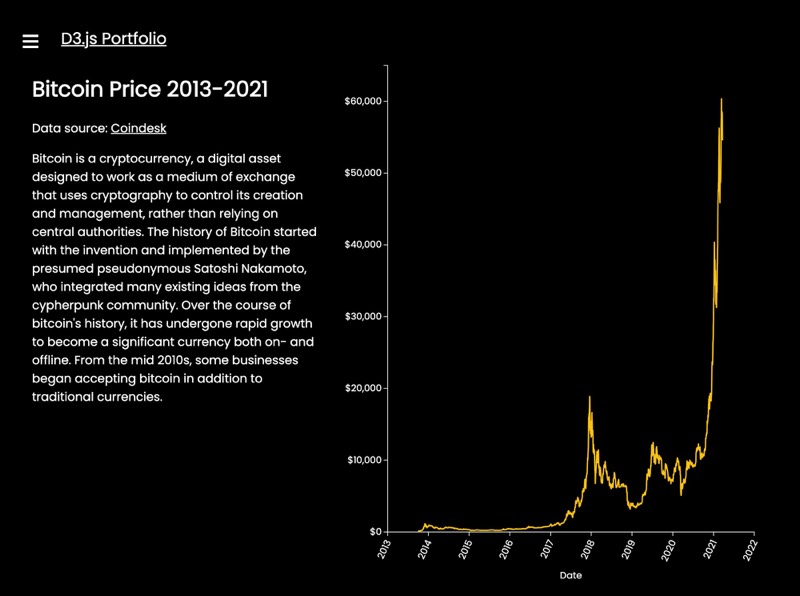
Line & Multi-Line Charts
Time series visualisations with interactive tooltips. Single and multi-line variants.
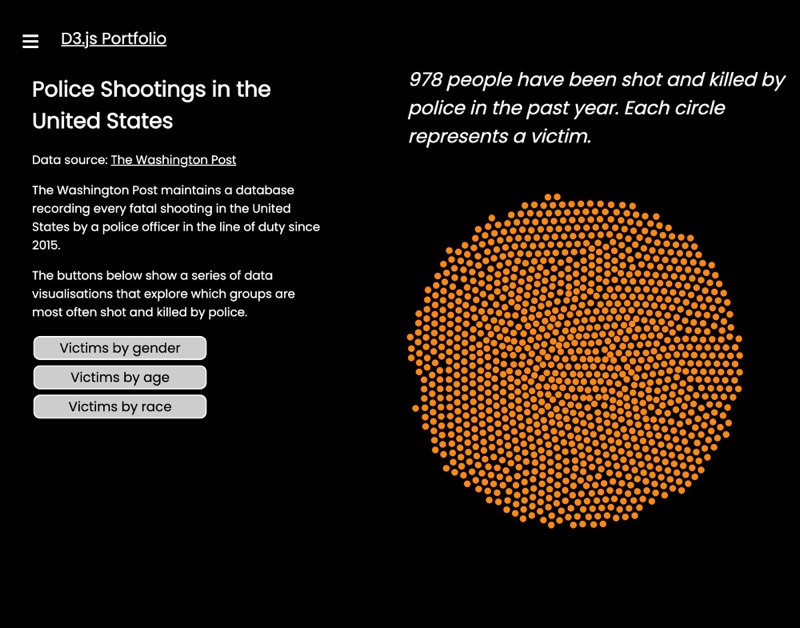
Beeswarm Chart
Force-based beeswarm plot for visualising distributions with individual data points.